前言
投資 ETF 近年來成為顯學,分散風險的特性被廣為了解後,越來越多投資人願意將資金投資在 ETF 上,而 0050 作為老牌 ETF ,自然是許多人的首選。
本篇文章將會分析多種情境下投資 0050 的報酬率表現,資料期間為 2004 年 3 月 1 日到 2024 年 2 月 22 日。
分析前準備
導入需要的套件及調整視覺化的設定
import pandas as pd
import numpy as np
import matplotlib.pyplot as plt
import seaborn as sns
import os
import random

custom_params = {"axes.spines.right": False, "axes.spines.top": False}
sns.set_theme(style="ticks", rc=custom_params)
讀取檔案,先讀取價格資料
file_path = '../data/'
file_name = '0050_price_data.csv'
file_full_path = os.path.join(file_path, file_name)
price_df = pd.read_csv(file_full_path, parse_dates=['date'], dtype={'symbol':str})
再讀取股利資料
file_name = '0050_dividend_data.csv'
file_full_path = os.path.join(file_path, file_name)
dividend_df = pd.read_csv(file_full_path, parse_dates=['ex_dividend_date', 'dividend_receive_date'], dtype={'symbol':str})
定義等等會用到的變數,收盤價、交易日及股價資料。
close_prices = price_df.close.values
dates = price_df.date.values
dividend_data = dict(zip(
        dividend_df.ex_dividend_date.values,
        dividend_df.dividend_amount.values
    ))
情境分析
定義一個函式,內容為計算每一個交易日的收盤價買入後,持有 n 天的報酬率,如果持有期間碰到除息日,同樣將股利一並計算。
def get_ret_list(holding_days:int) -> list[float]:
    ret_list = []
    for i in range(0, len(close_prices) - holding_days):
        buy_price = close_prices[i]
        sell_price = close_prices[i + holding_days]

        holding_periods = dates[i:i + holding_days]
        dividend = 0
        for ex_dividend_date, amount in dividend_data.items():
            if ex_dividend_date in holding_periods:
                dividend += amount

        ret = (sell_price + dividend) / buy_price - 1
        ret_list.append(ret)
    return ret_list
舉例而言,執行下方的程式碼,就是計算資料期間每個交易日的收盤價買入後,在 20 天後的收盤價賣出,所得到的報酬率。
get_ret_list(20)
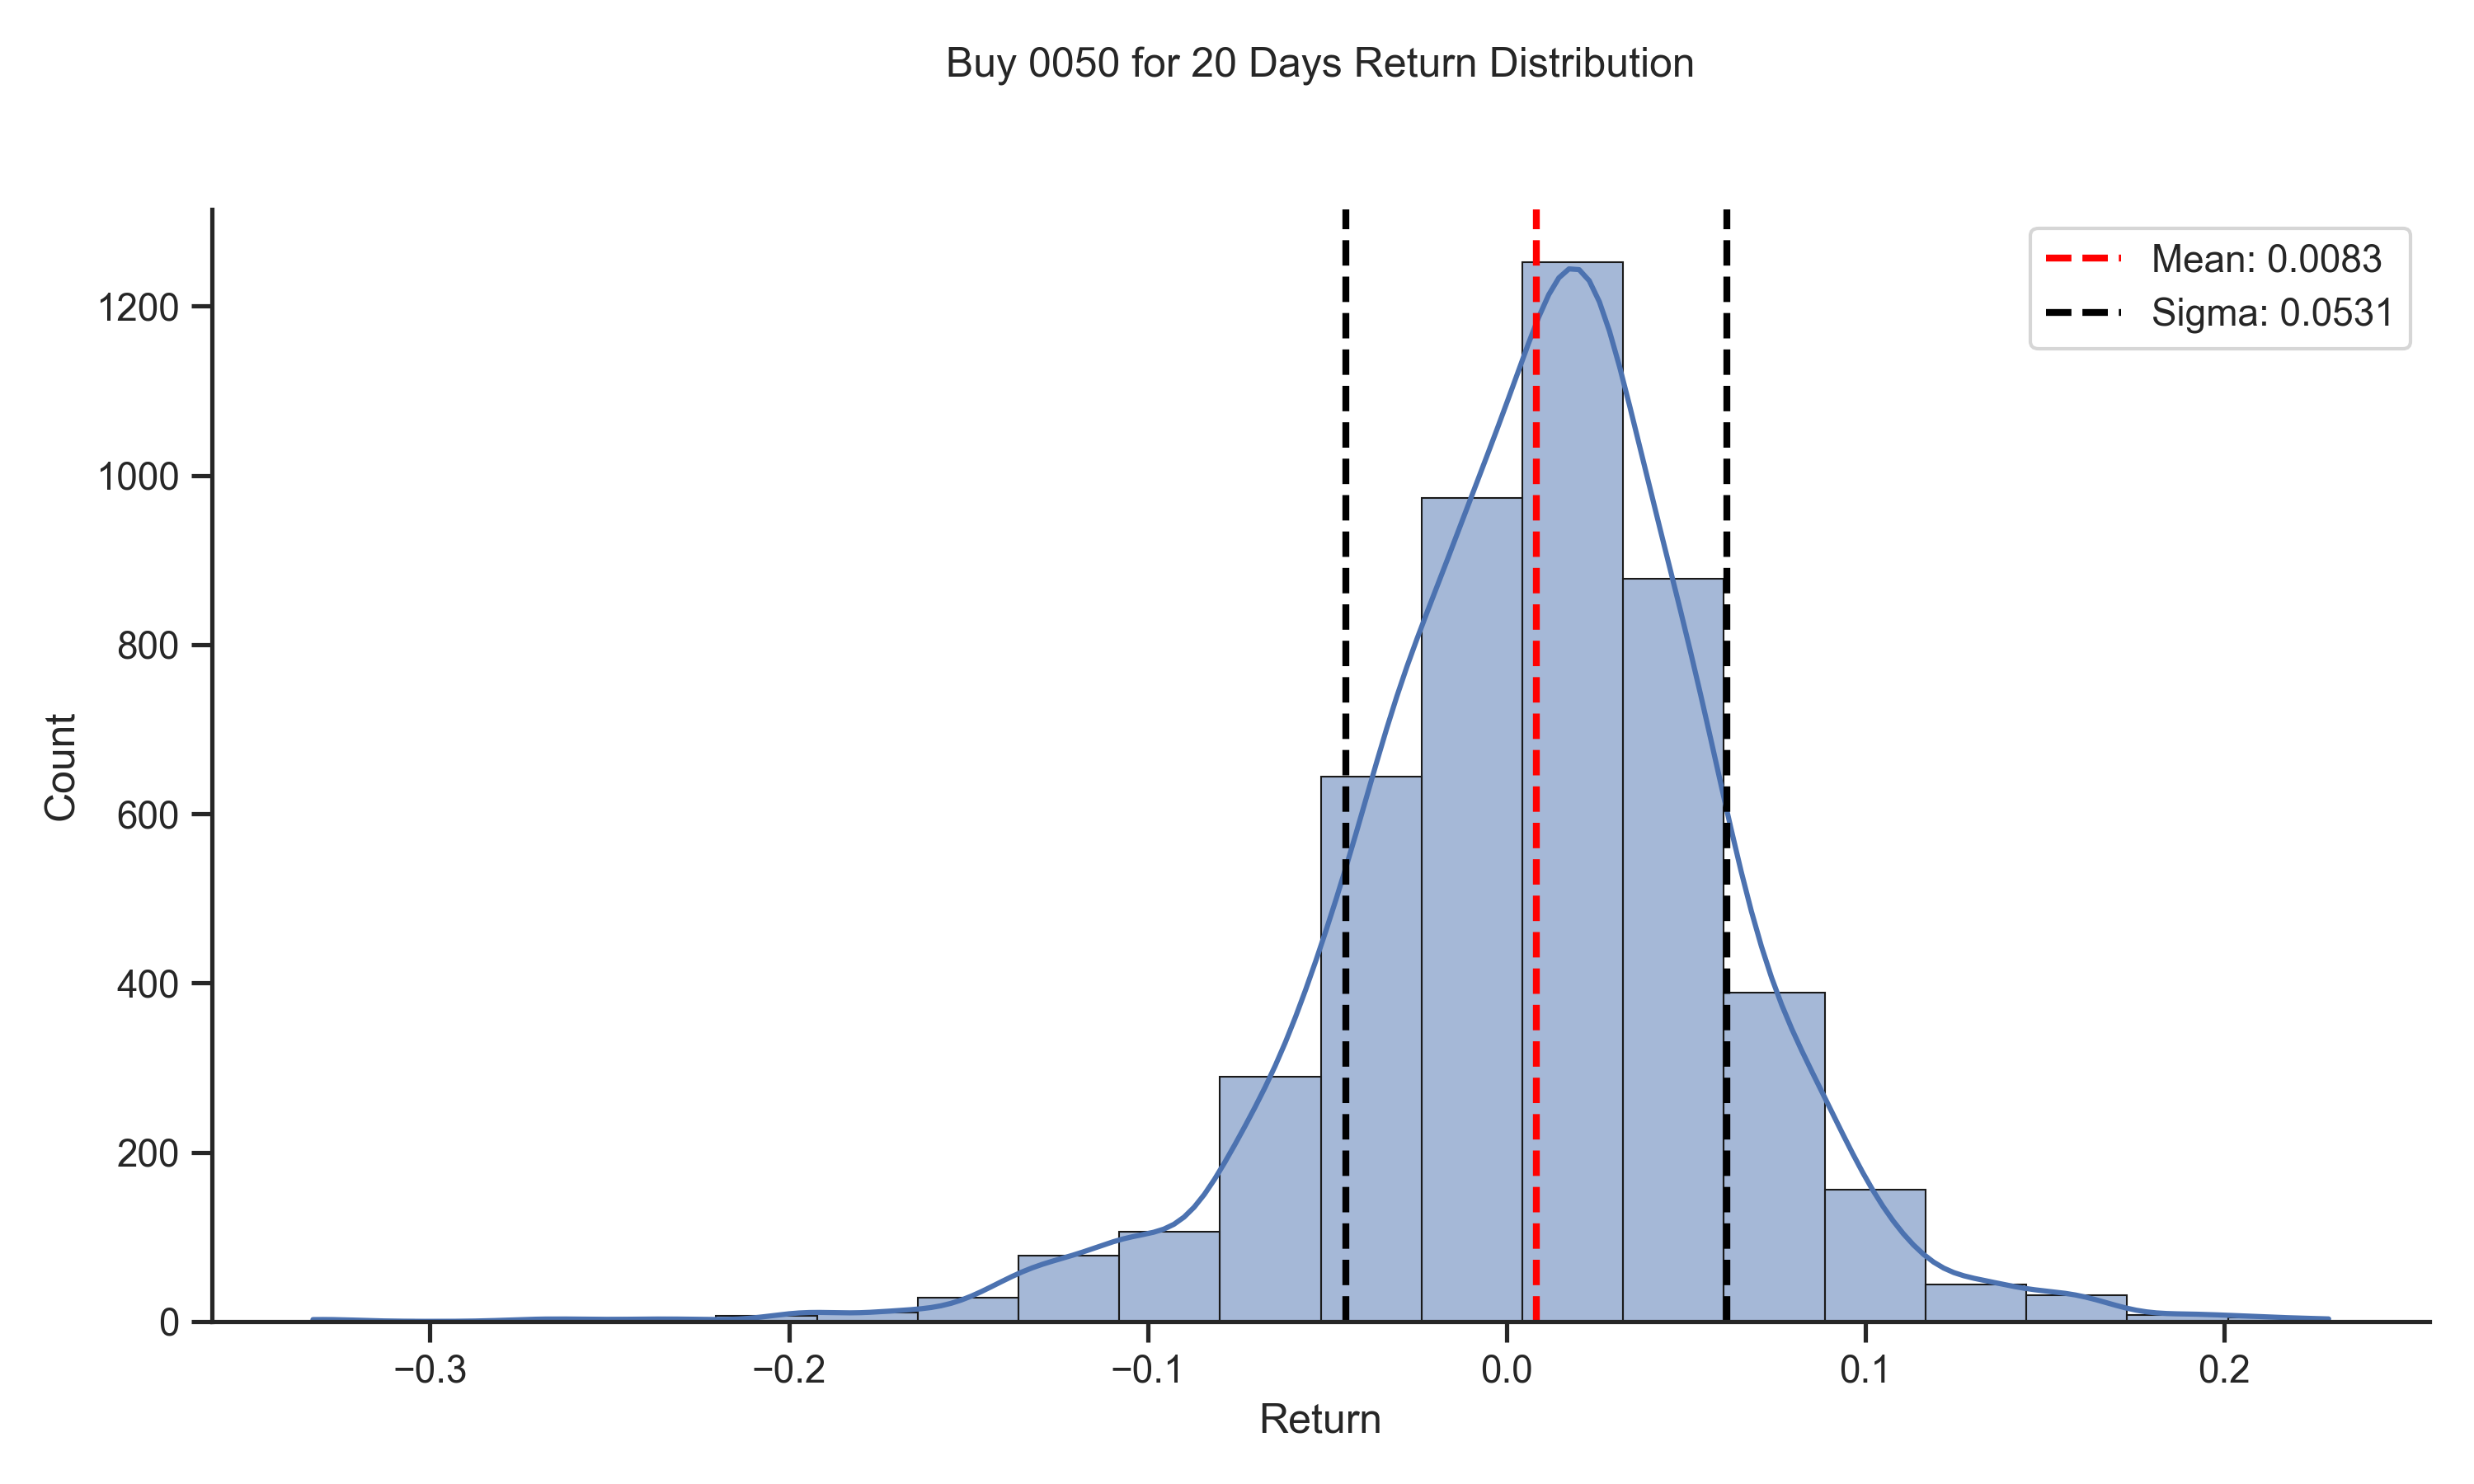
先來畫個圖看這樣的情況下,報酬率分佈會是如何。
holding_period = 20

fig, ax = plt.subplots(1, 1, figsize=(10, 6))

ret_list = get_ret_list(holding_period)
data = np.array(ret_list)
sns.histplot(data, kde=True, bins=20, ec='k', linewidth=0.5, ax=ax)

mean = np.mean(data)
std_dev = np.std(data)

ax.axvline(mean, color='red', linestyle='--', label=f'Mean: {mean:.4f}', linewidth=2)
ax.axvline(mean + std_dev, color='black', linestyle='--', label=f'Sigma: {std_dev:.4f}', linewidth=2)
ax.axvline(mean - std_dev, color='black', linestyle='--', linewidth=2)
ax.set_title(f'Buy 0050 for {holding_period} Days Return Distribution', y=1.1)
ax.legend(loc='upper right')
ax.set_xlabel('Return')
ax.set_ylabel('Count')

plt.tight_layout()
plt.show()
從整體資料來看,在任一交易日買入後並持有 20 天,平均報酬率為 0.8%。

接著來增加買入條件,達到條件則用隔日的收盤價買入,再持有 n 天,並計算報酬率,同樣有包含股利收入,來和無條件直接買入比較。
使用的條件為,當過去 m 天的股價報酬率大於或小於 x 時,則買入持有 n 天,函式如下。
def get_ret_list_with_condition(past_days:int, ret_threshold: float, condition:str, holding_days:int) -> list[float]:
    close_prices = price_df.close.values
    ret_list = []
    for i in range(0 + past_days, len(close_prices) - holding_days - 1):
        today_close = close_prices[i]
        n_days_before_close = close_prices[i - past_days]
        past_ret = today_close / n_days_before_close - 1

        if condition == 'gt':
            signal = past_ret > ret_threshold
        elif condition == 'lt':
            signal = past_ret < ret_threshold
        else:
            raise ValueError('wrong condition.')

        if signal:
            dividend = 0
            buy_price = close_prices[i + 1]
            sell_price = close_prices[i + 1 + holding_days]
            holding_periods = dates[i:i + holding_days]
            for ex_dividend_date, amount in dividend_data.items():
                if ex_dividend_date in holding_periods:
                    dividend += amount

            ret = (sell_price + dividend) / buy_price - 1
            ret_list.append(ret)

    return ret_list
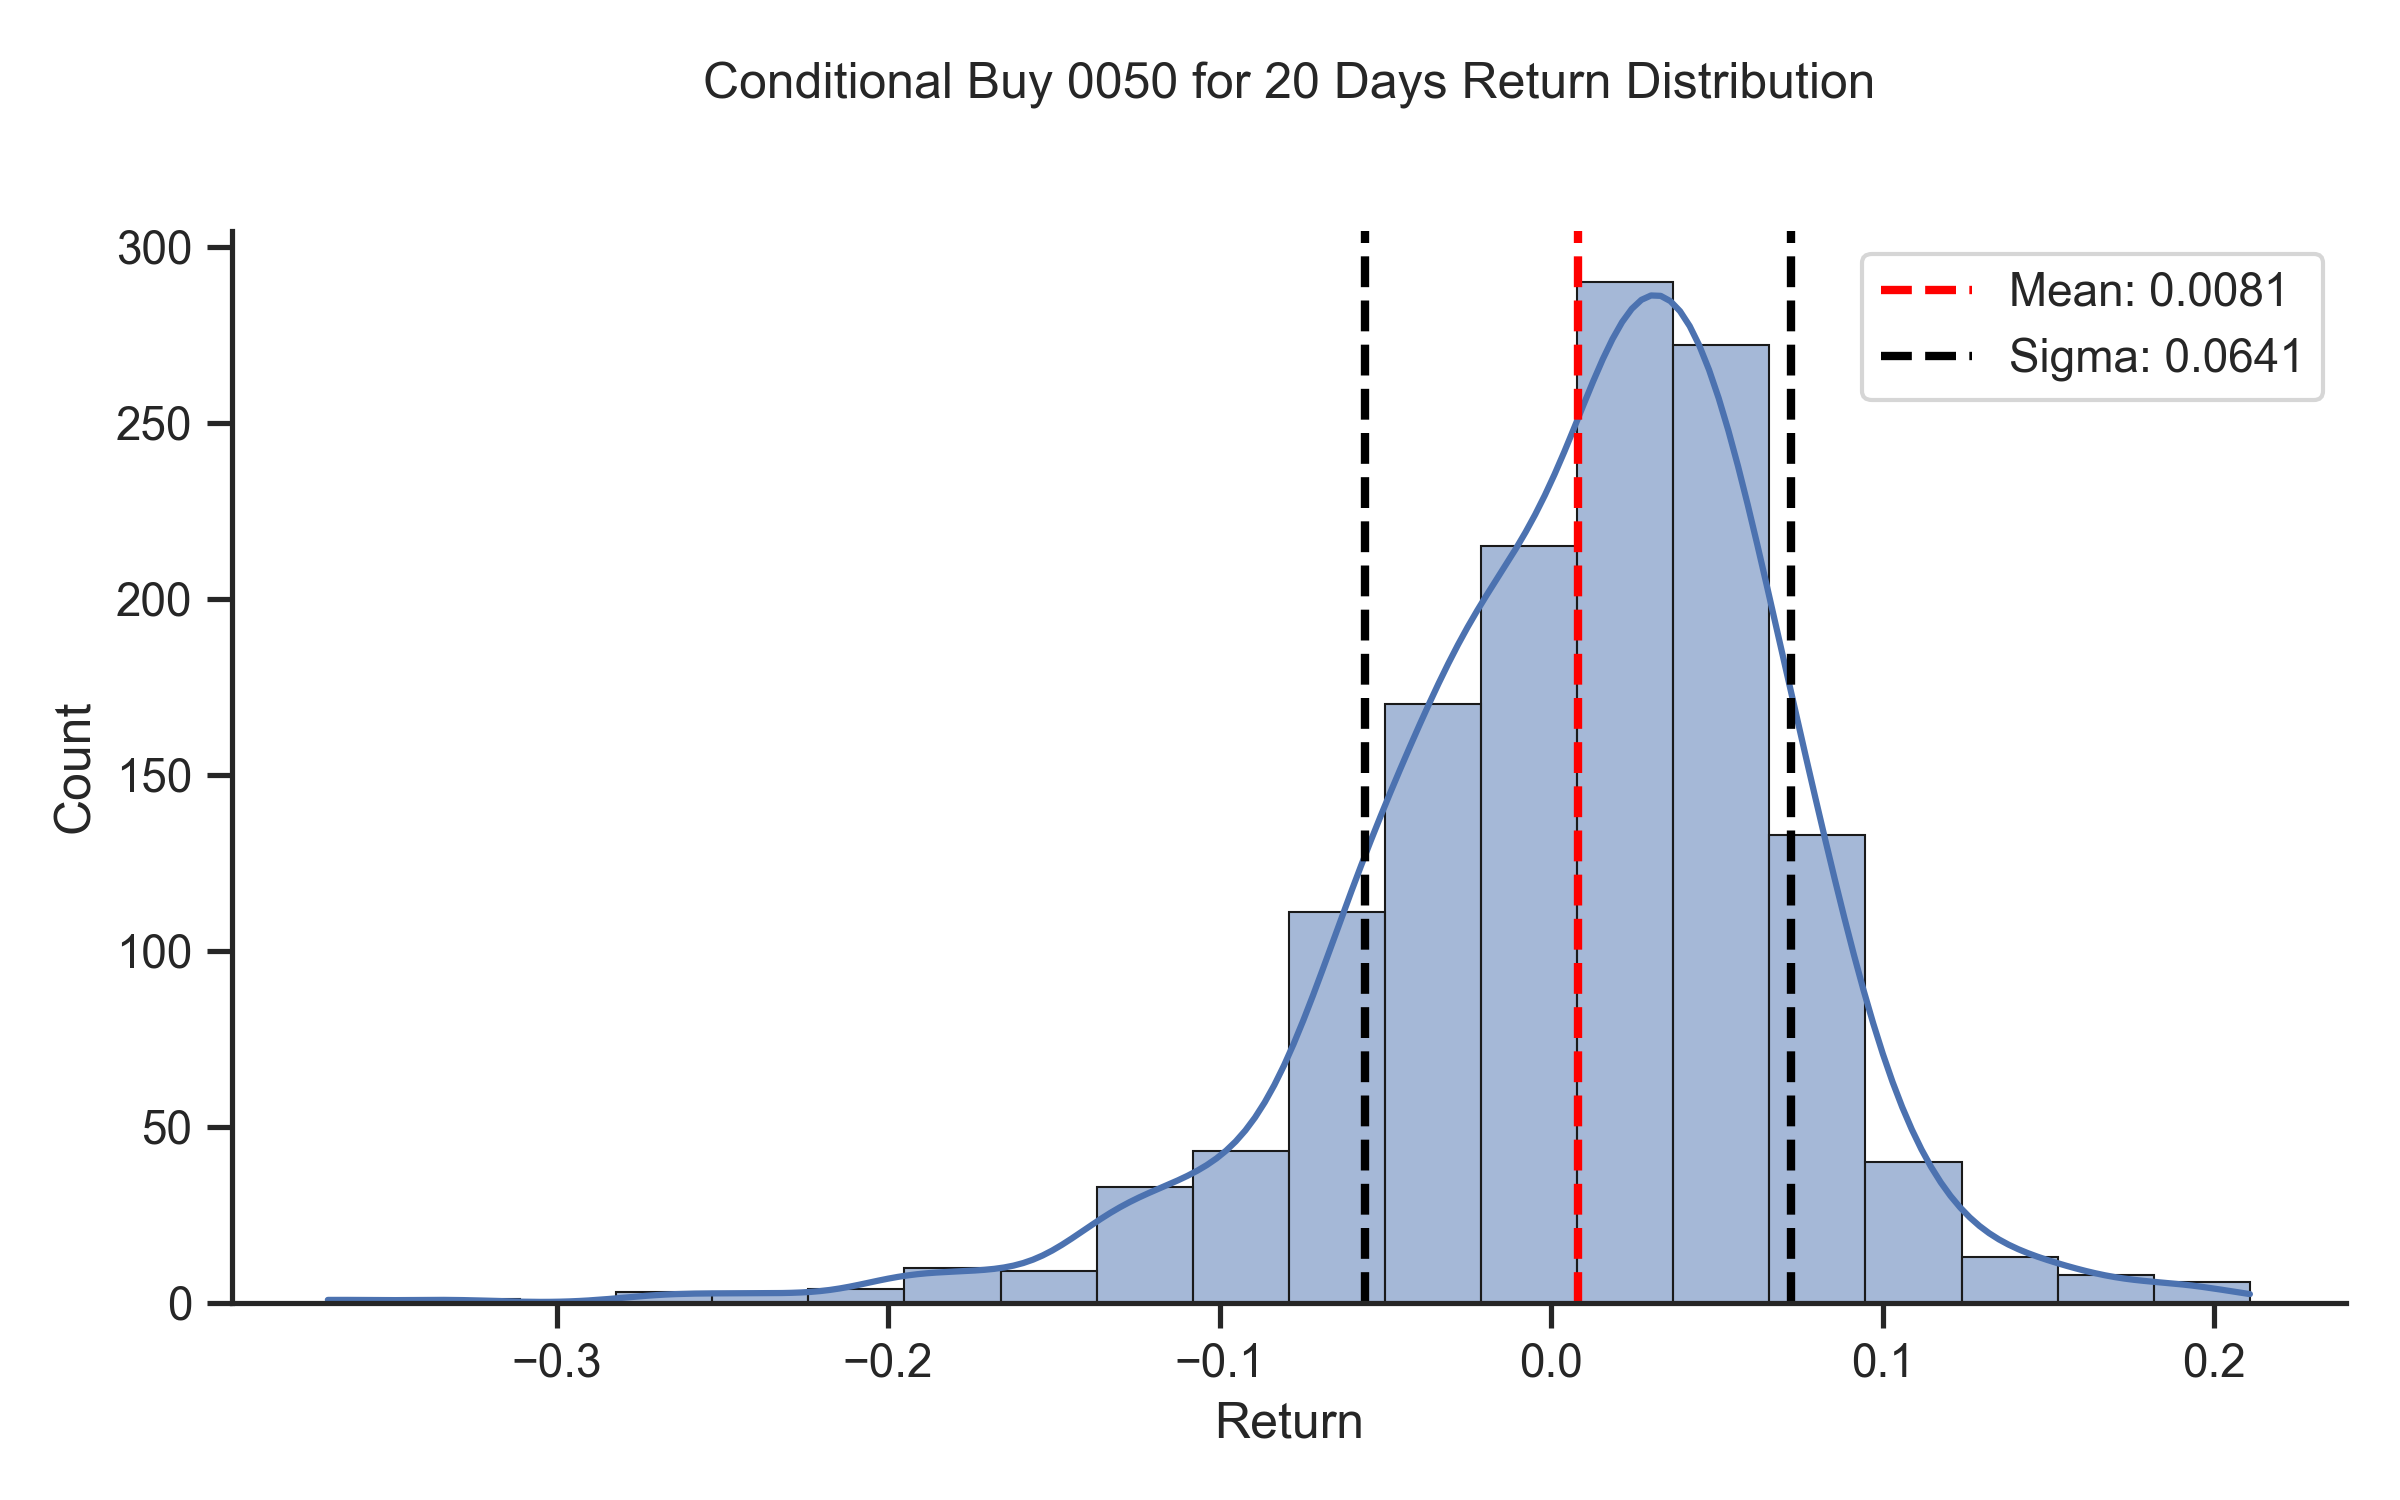
同樣也來看看持有 20 天的表現如何,同時設定條件為,當過去 20 天的報酬率低於 -2% 時買入。
holding_period = 20
past_days = 20
ret_threshold = -0.02
condition = 'lt'

fig, ax = plt.subplots(1, 1, figsize=(8, 5))

ret_list = get_ret_list_with_condition(past_days, ret_threshold, condition, holding_period)
data = np.array(ret_list)
sns.histplot(data, kde=True, bins=20, ec='k', linewidth=0.5, ax=ax)

mean = np.mean(data)
std_dev = np.std(data)

ax.axvline(mean, color='red', linestyle='--', label=f'Mean: {mean:.4f}', linewidth=2)
ax.axvline(mean + std_dev, color='black', linestyle='--', label=f'Sigma: {std_dev:.4f}', linewidth=2)
ax.axvline(mean - std_dev, color='black', linestyle='--', linewidth=2)
ax.set_title(f'Conditional Hold 0050 for {holding_period} Days Return Distribution', y=1.1)
ax.legend(loc='upper right')
ax.set_xlabel('Return')
ax.set_ylabel('Count')

plt.tight_layout()
plt.show()
報酬率看來並無太大的差別,報酬率分佈的波動度也是。

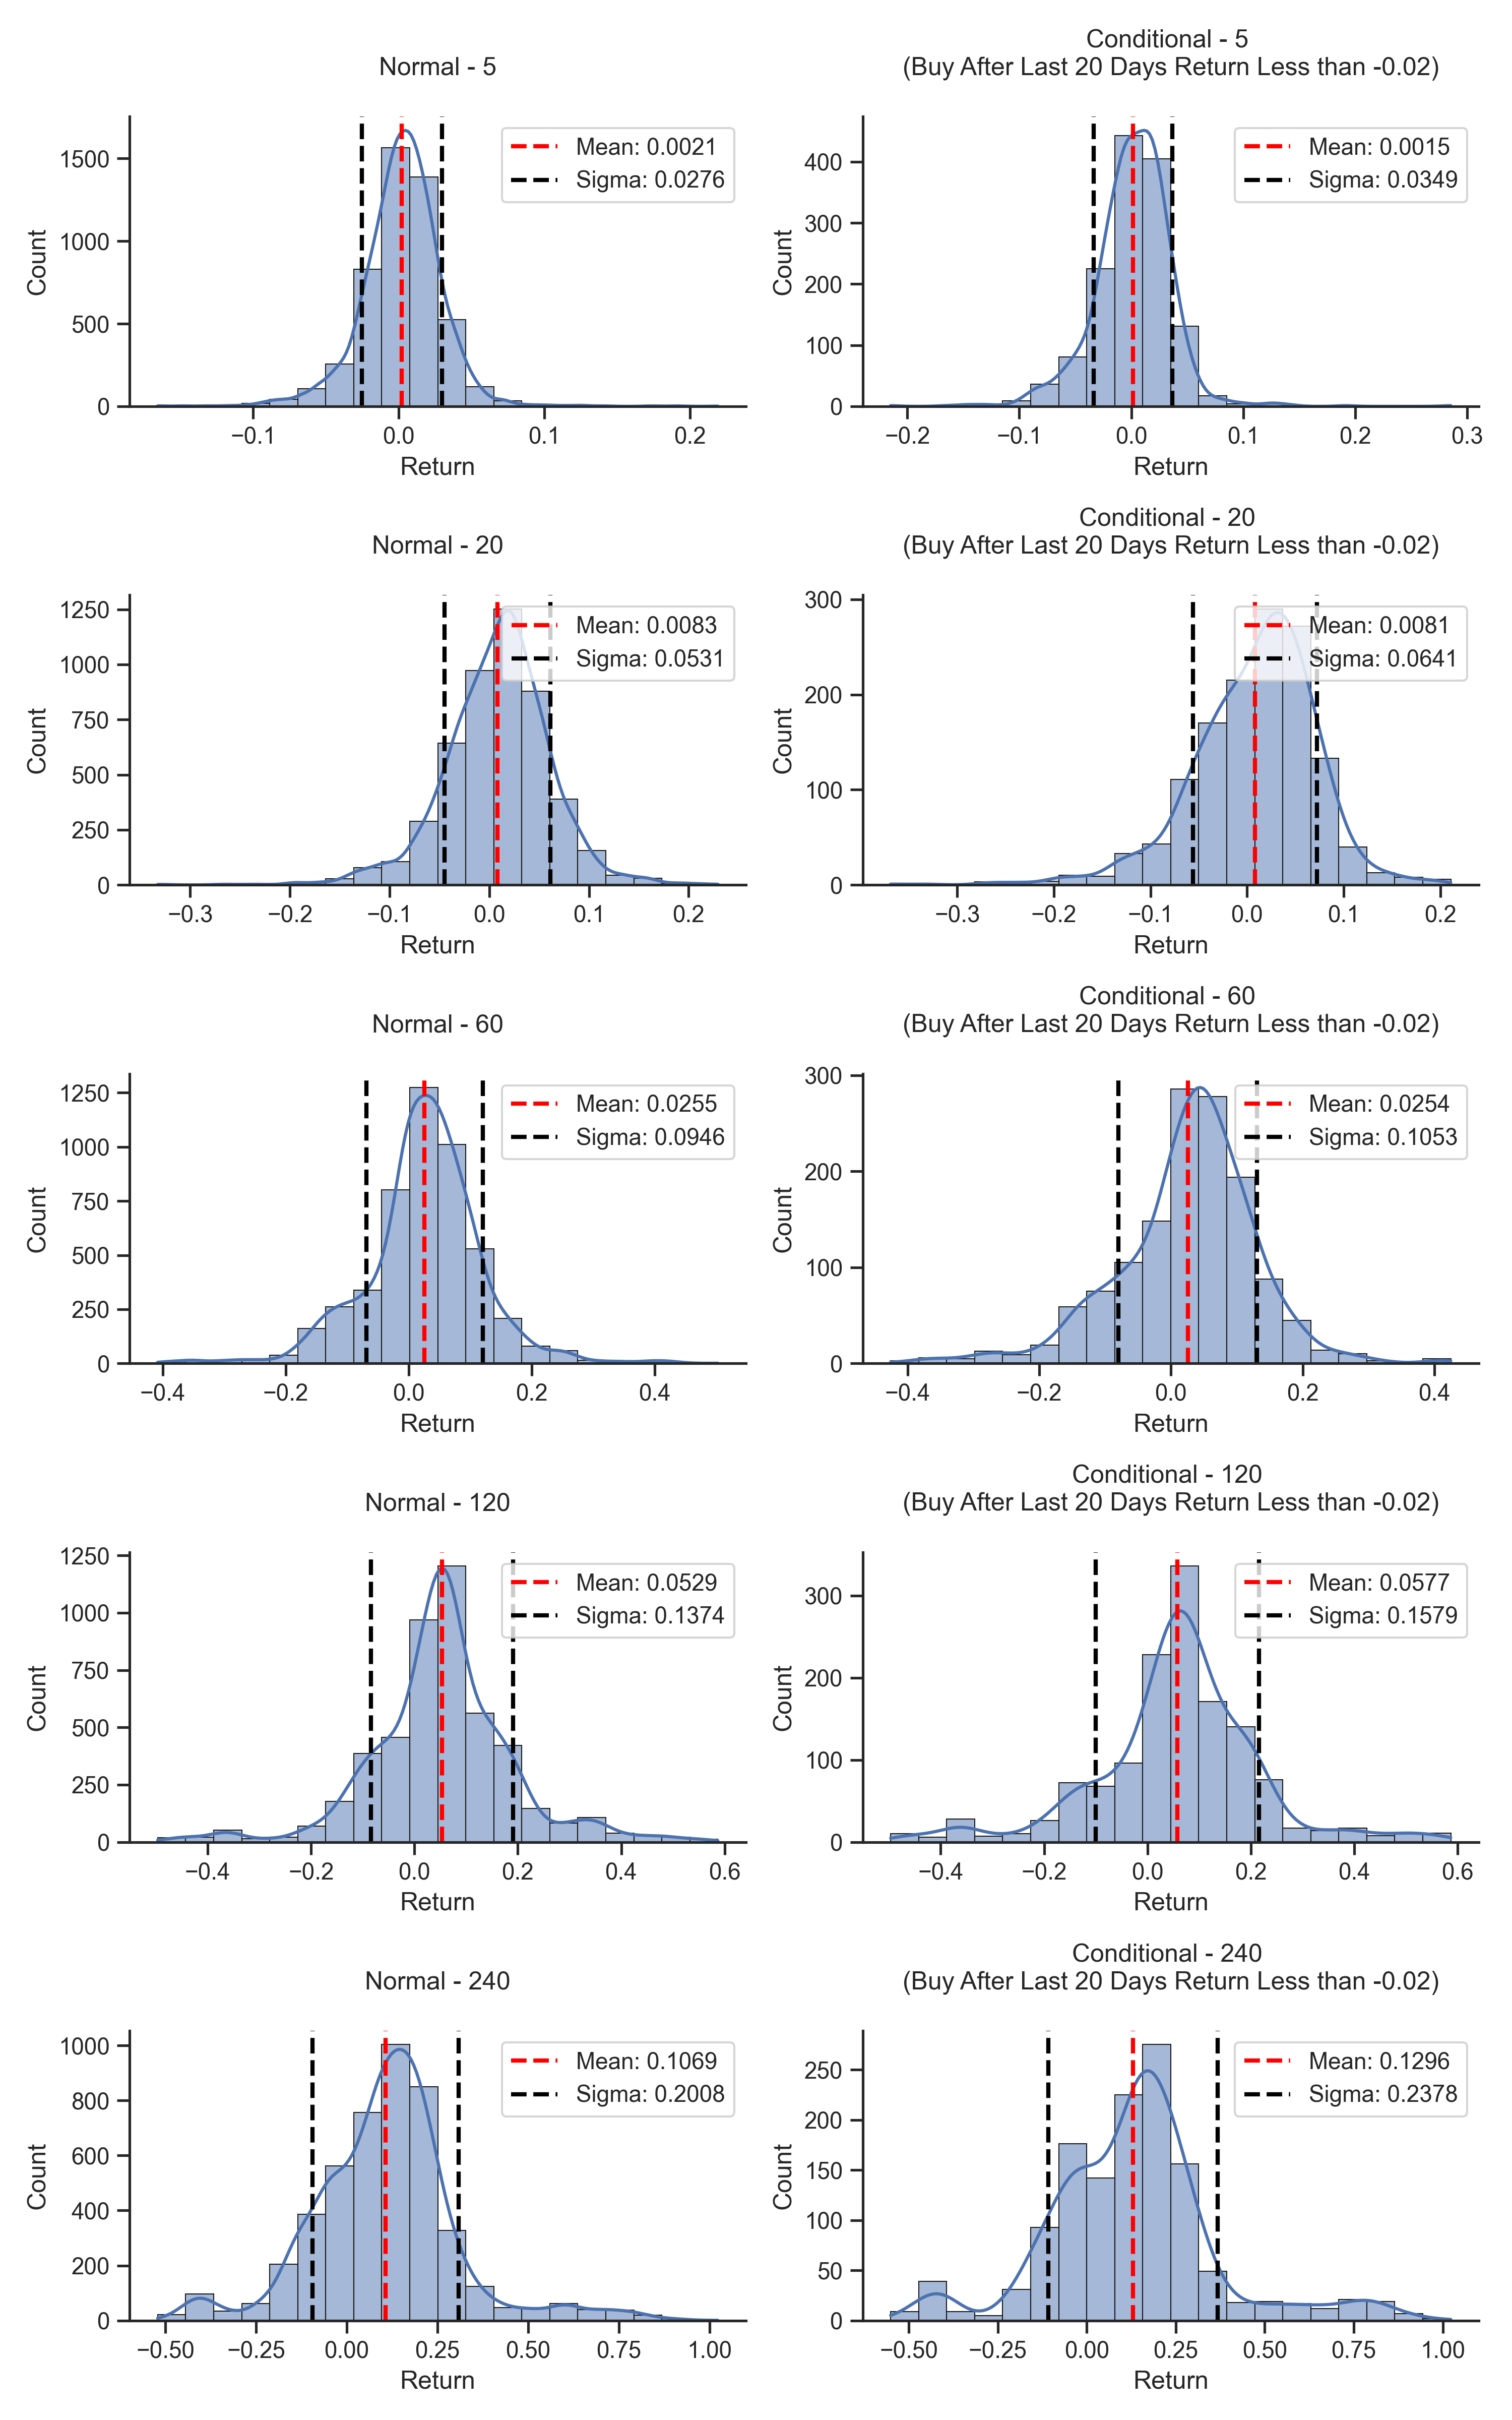
再來以同樣條件,比較不同持有期間的結果。
past_days = 20
ret_threshold = -0.02
condition = 'lt'

fig, axes = plt.subplots(5, 2, figsize=(10, 16))

for idx, holding_days in enumerate([5, 20, 60, 120, 240]):

    ret_list = get_ret_list(holding_days)
    data = np.array(ret_list)
    ax = axes[idx, 0]
    sns.histplot(data, kde=True, bins=20, ec='k', linewidth=0.5, ax=ax)

    mean = np.mean(data)
    std_dev = np.std(data)

    ax.axvline(mean, color='red', linestyle='--', label=f'Mean: {mean:.4f}', linewidth=2)
    ax.axvline(mean + std_dev, color='black', linestyle='--', label=f'Sigma: {std_dev:.4f}', linewidth=2)
    ax.axvline(mean - std_dev, color='black', linestyle='--', linewidth=2)
    ax.set_title(f'Normal - {holding_days}', y=1.1)
    ax.legend(loc='upper right')
    ax.set_xlabel('Return')
    ax.set_ylabel('Count')


    ret_list = get_ret_list_with_condition(past_days, ret_threshold, condition, holding_days)
    data = np.array(ret_list)
    ax = axes[idx, 1]
    sns.histplot(data, kde=True, bins=20, ec='k', linewidth=0.5, ax=ax)

    mean = np.mean(data)
    std_dev = np.std(data)

    ax.axvline(mean, color='red', linestyle='--', label=f'Mean: {mean:.4f}', linewidth=2)
    ax.axvline(mean + std_dev, color='black', linestyle='--', label=f'Sigma: {std_dev:.4f}', linewidth=2)
    ax.axvline(mean - std_dev, color='black', linestyle='--', linewidth=2)
    ax.set_title(f'Conditional - {holding_days} \n(Buy After Last {past_days} Days Return Less than {ret_threshold})', y=1.1)
    ax.legend(loc='upper right')
    ax.set_xlabel('Return')
    ax.set_ylabel('Count')


plt.tight_layout()
plt.show()
從結果看來,天期拉長後報酬率會有微幅上升,但和無條件買入持有相比,仍然沒有太大區別。

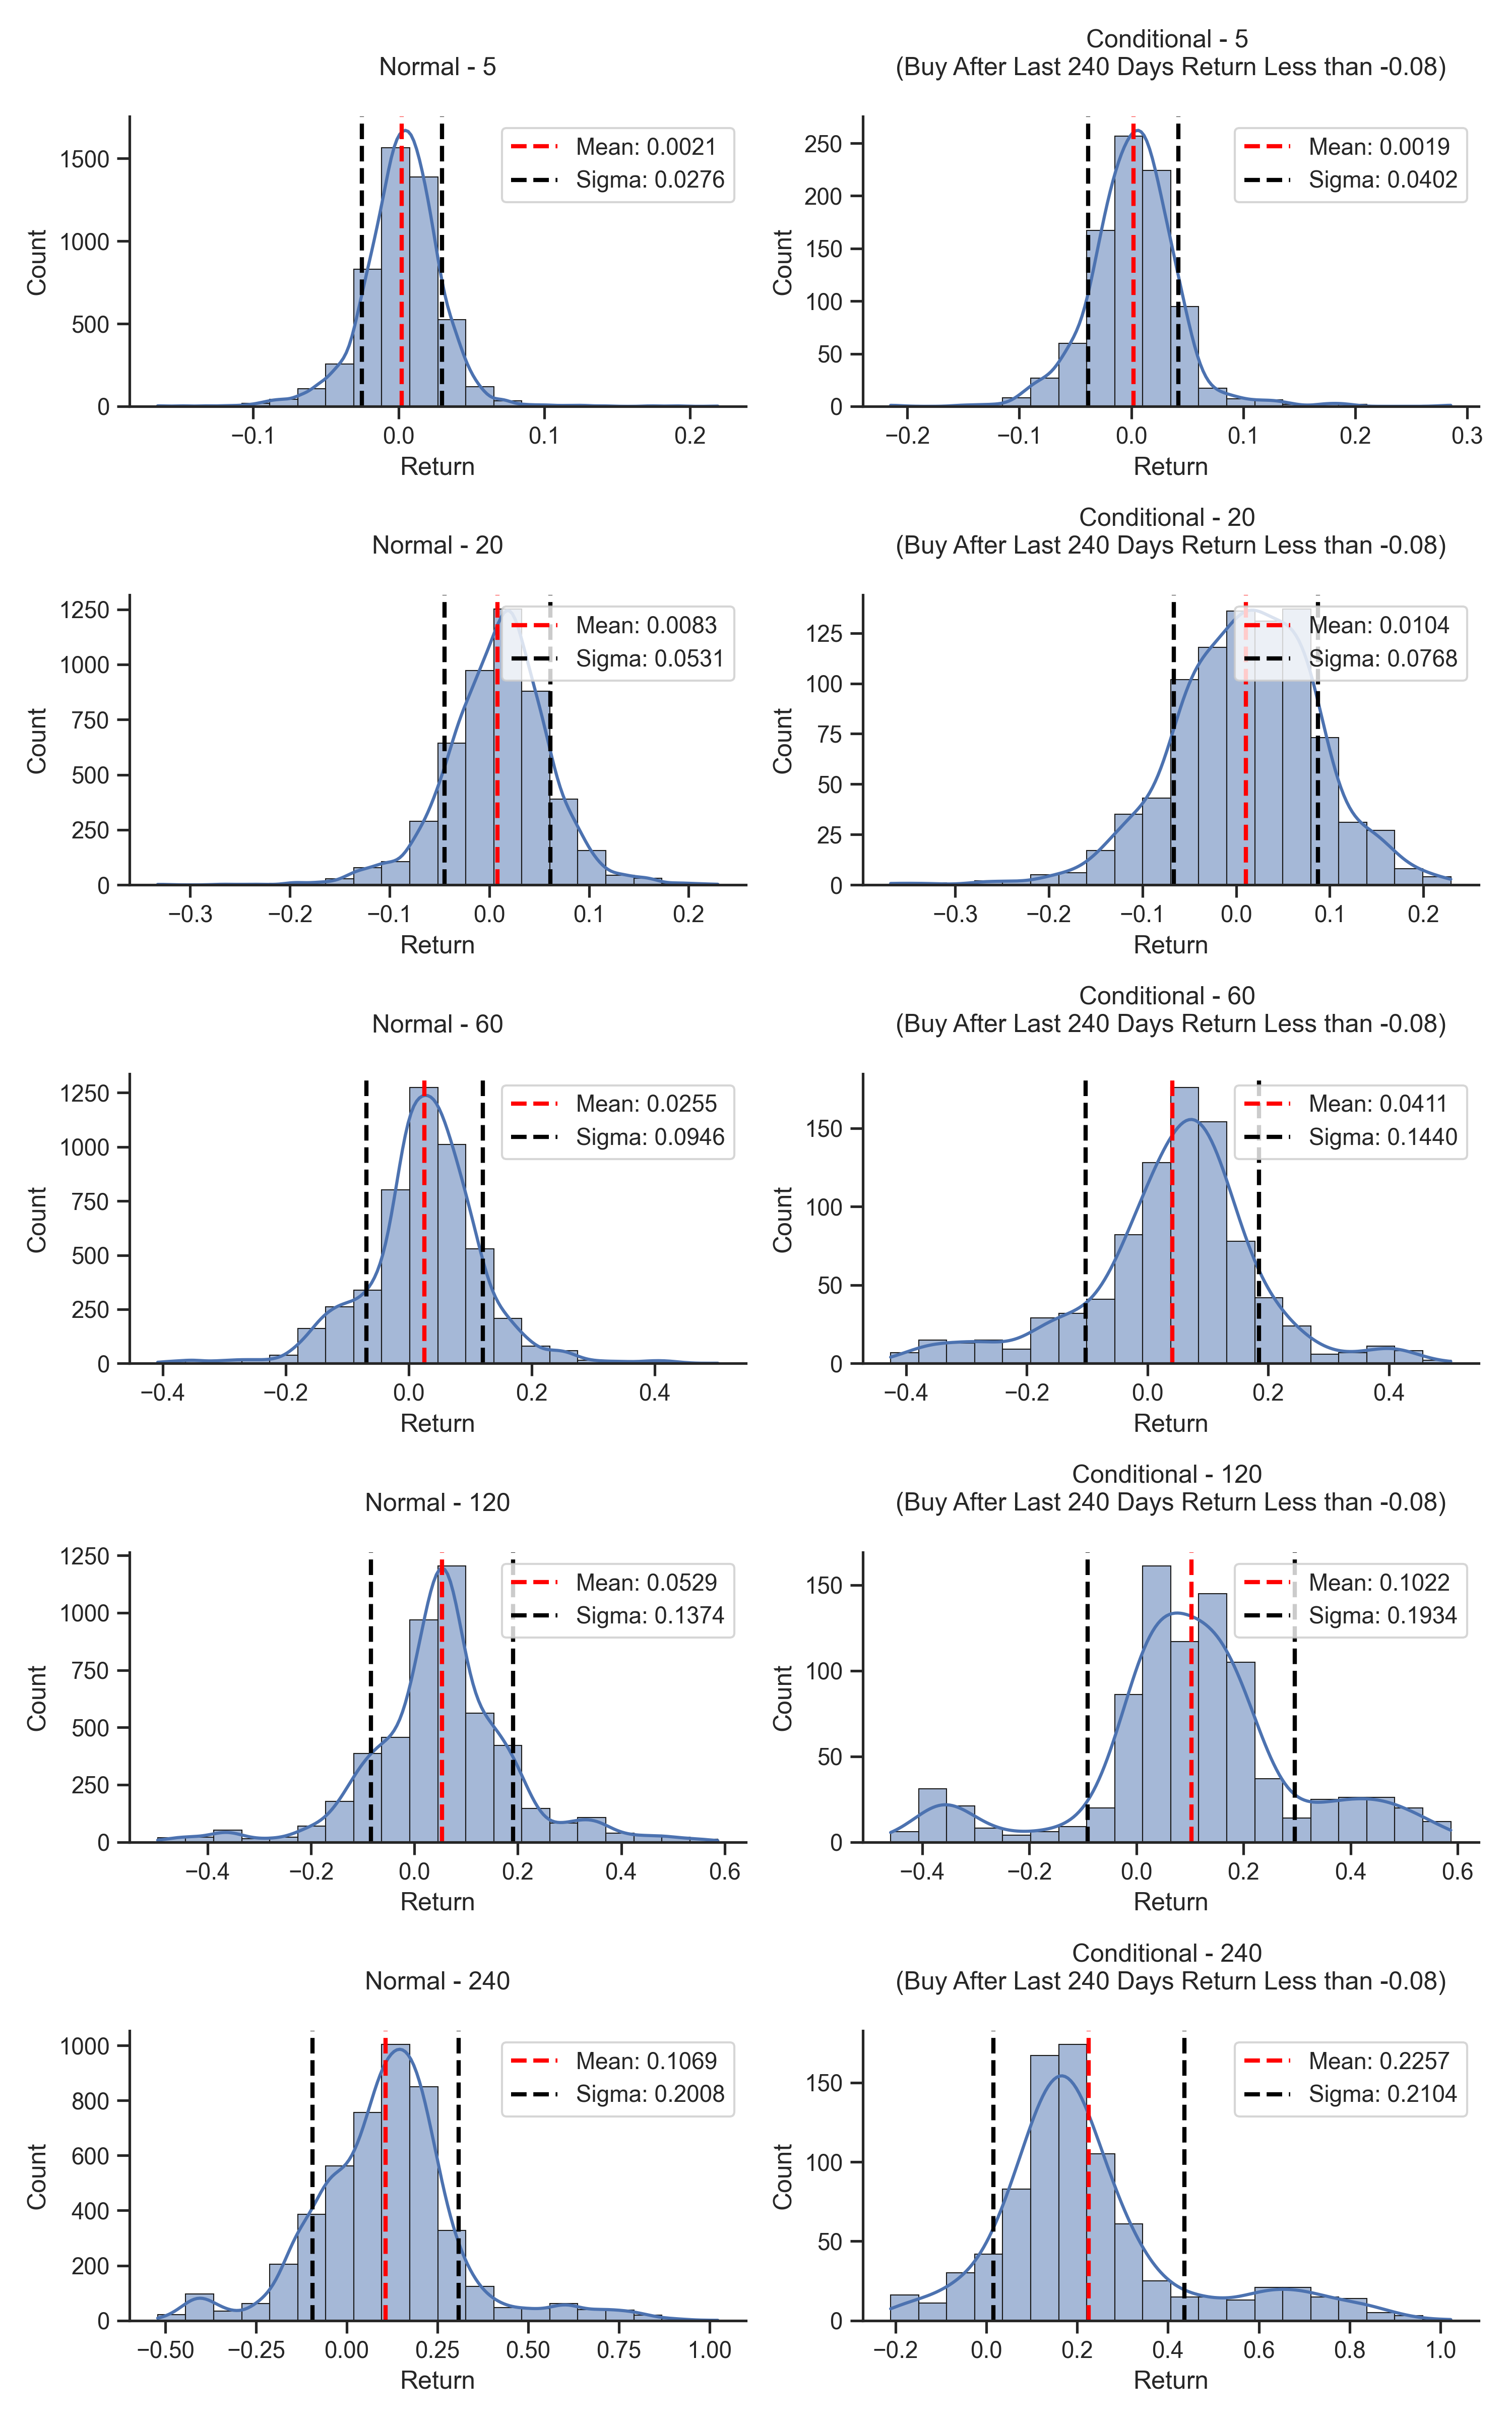
接著試著將條件調整一下,改為過去 240 個交易日的累積報酬率低於 -8% 時買入,看看結果如何。
past_days = 240
ret_threshold = -0.08
調整後,較短持有期間仍看不出明顯差別,但持有 240 個交易日,報酬率有明顯上升,且報酬率分佈的波動度反而沒有跟著增加,從整體來看,該條件發生後買入,在持有 240 個交易日後,有接近七成的結果會是正報酬。
看起來增加條件後的買入,並且長期持有,能夠幫助提升投資 0050 的表現。

結論
逢低買進並長期持有。

